Tools are helpful to save developers time. Looking into the demand of web technology everyday many new tools comes into the market. Among these tools Firebug is a popular one. Using Firebug a web developers can easily monitor, debug or edit HTML, CSS, JAVASCRIPT or Jquery codes. To install Firebug you can download the latest version from https://getfirebug.com/downloads/. Also you can install Firebug as an addon in Mozilla Firefox. To do this go to Tools > Addons or press CTRL + ALT + A. Search Firebug & install. After successful installation restart your browser. Then press F12 to open Firebug. In below read our manual to get started.
There are various tabs available in default window of Firebug. Console, HTML, CSS, Script, DOM & NET. Using Console you can see the error or you can watch value of a print statement. HTML tab will show you the current page HTML source code. Here you can add or edit HTML in real-time. CSS & Script tabs is similar to HTML tab functionality. Using this tabs you can watch related CSS & JS files. If multiple CSS or JS files attached to your page you can use dropdownlist (shown in top bar) to select the required file. DOM tab presents Document object model hierarchy. Net tab is useful to track network related responses.
How to use Firebug?
1. Without interacting with the real source code you can use inspect elements to edit HTML & CSS. This process saves lot of time & efforts. Also it reduces the chance of risk to work directly with files. In case you want to test some HTML or CSS related changes you can do this in real-time using Firebug. Once changes are done properly you can copy the codes to related files.
Let’s take a case where you want to adjust a div height just similar to an image height. In this case without using Firebug you need to measure the image height & then you will update the height for the div. But using firebug you can update the height attribute in real-time. When the height will look similar you can copy that value to your code file. This approach is programmers friendly & saves time.
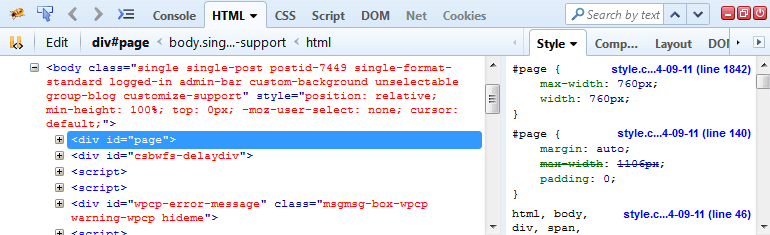
2. During development some time it is difficult to know where CSS boxes are located. In this case Firebug is very helpful. Firebug has its own eyes. While you select the block of code it will show you how much areas the CSS box model affects in your HTML. Look at the below image you will get idea how it works.

3. To optimize a web page it is mandatory to observe network activity. I mean which process or resource takes how much memory & time to load. Firebug is rich with this facility. Using its network monitoring tool you can easily know which thread breaks performance. To guide you how to perform network checking look at the below image.

Using Firebug network observation tool you can know the Status (Request is Fail or Passed), From which domain response backs, Size of the file & Timeline (How much time the resource need to load).
4. One more advanced feature of Firebug is it provides JAVASCRIPT & Jquery debugger. While you run a HTML file this tool will show you how many JAVASCRIPT files are related to that particular HTML page. If in any JS file you want to know the execution you can set breakpoints & debug like a professional debugger.

5. During web development unknowingly we left many errors in page. Thanks to Firebug which helps to detect all those error for a error free web page. To know about the list of errors you page has. Go to Console window & all errors tab.

6. The Document Object Model (DOM) is a great big hierarchy of objects & functions just waiting to be tickled by JavaScript. Firebug helps you find DOM objects quickly and then edit them on the fly.