


During Network related web application development some time we required to draw Topology view. Recently I worked for the Customer Vodafone to design their mobile tracking system. Here I got an opportunity to create node & traffic related topology view. To achieve this in the app I used D3.js. D3.js is a popular JavaScript library to draw graphs using SVG. It accepts JSON formatted data. Due to the customer database is with MongoDB I preferred to use D3.js to draw their Network Topology.
In the below example I am not using any database to fetch the data from server. To show you how to create a Network Topology graph using D3.js here I declared some demo data in data variable. Which is in JSON format. To start with here I referred D3.js CDN link in head part of the HTML. In body part I have a div with id “topology”. Using D3.js select method I am appending SVG to the topology div. Width & Height are the parameters of the SVG. In this example not only I implemented topology view but also I added features like drag, zoom & tooltip.
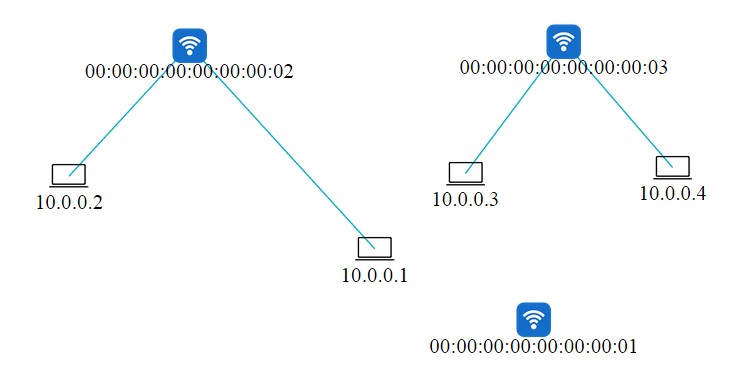
To run this sample application copy the following code to a Notepad file & save it as html. Then open the HTML file. Make sure before run the file you are connected to internet. For nodes images here I added imageByType. You need to update image paths refer to your images.
Network Topology graph using D3.js
<!DOCTYPE html>
<html>
<head>
<title>Network Topology graph using D3.js</title>
<meta http-equiv="Content-Type" content="text/html;charset=utf-8"/>
<script src="https://cdnjs.cloudflare.com/ajax/libs/d3/3.5.3/d3.min.js"></script>
<style type="text/css">
.online-color {
stroke: #01ACC6;
stroke-width: 1px;
stroke-opacity: 1.0;
}
</style>
</head>
<body>
<div id="topology"></div>
<script type="text/javascript">

var data = {
"status": 200,
"content": {
"directed": false,
"links": [
{
"status": "online",
"source": 1,
"target": 2
},
{
"status": "online",
"source": 2,
"target": 5
},
{
"status": "online",
"source": 3,
"target": 4
},
{
"status": "online",
"source": 3,
"target": 6
}
],
"multigraph": false,
"graph": [],
"nodes": [
{
"status": "online",
"forwarding_policy": "0",
"type": "switch",
"id": "00:00:00:00:00:00:00:01",
"type_of_switch": "OF"
},
{
"status": "offline",
"_id": "54af98aea1234b06bbac8d5d",
"type": "host",
"id": "10.0.0.4"
},
{
"status": "online",
"forwarding_policy": "0",
"type": "switch",
"id": "00:00:00:00:00:00:00:03",
"type_of_switch": "OF"
},
{
"status": "online",
"forwarding_policy": "0",
"type": "switch",
"id": "00:00:00:00:00:00:00:02",
"type_of_switch": "OF"
},
{
"status": "offline",
"_id": "54af98aea1234b06bbac8d5e",
"type": "host",
"id": "10.0.0.1"
},
{
"status": "offline",
"_id": "54af98aea1234b06bbac8d5f",
"type": "host",
"id": "10.0.0.3"
},
{
"status": "offline",
"_id": "54af98aea1234b06bbac8d60",
"type": "host",
"id": "10.0.0.2"
}
],
"last_seen": "1421832648.22"
},
"message": "success"
};

var width = 1013,
height = 578,
linkedByIndex = {},
node=null,
link=null,
force=null,
nodelinks = null,
sourceStatus="",
imageByType = {
"host_online" : "images/ap.png",
"switch_online" : "images/laptop.png",
"host_offline" : "images/ipad.png",
"switch_offline" : "images/ipad.png"
};

function drawNetworkTopology(data) {
force = d3.layout.force()
.nodes(data.content.nodes)
.links(data.content.links)
.linkDistance(100)
.charge(-600)
.size([width, height])
.start();

//add zoom behavior to nodes
var zoom = d3.behavior.zoom()
.scaleExtent([1, 3])
.on("zoom", zoomed);

//add drag behavior to nodes
var drag = d3.behavior.drag()
.on("dragstart", dragstarted)
.on("drag", dragged)
.on("dragend", dragended);

//create svg element using d3
var svg = d3.select("div#topology").append("svg")
.attr("viewBox", "0 0 " + width + " " + height )
.attr("preserveAspectRatio", "xMidYMid meet")
.call(zoom);

//append container lable to bounding box
svg.append("text")
.text("")
.attr({
'x' : width-70,
'y' : height-5,
"text-anchor" : "middle",
});

//add bounding box
svg.append("rect")
.attr({
"width" : width,
"height" : height,
})
.style({
"fill" : "none",
});

//add container
var containerGrp = svg.append("g");

//add group of all lines
link = containerGrp
.selectAll("line")
.data(data.content.links)
.enter().append("line")
.attr({
"class" : function (data) {
return data.status+"-color";
}
});

//add group of all nodes
node = containerGrp
.selectAll(".node")
.data(data.content.nodes)
.enter().append("g")
.attr({
"class" : "nodes",
"cx" : function (d) {
return d.x;
},
"cy" : function (d) {
return d.y;
},
})
.call(drag);

//add image to node dynamically
node.append("image")
.attr({
"xlink:href" : function (d) {
if(d.status === ('online').toLocaleLowerCase() && d.forwarding_policy == 1)
return "images/proactive_forward.png";
else
return imageByType[d.type+"_"+d.status];
},
"x" : -15,
"y" : -15,
"width" : 30,
"height" : 30,
})
.on("click",function(d){
if (d3.event.defaultPrevented) return; // click suppressed
})
.on("mouseover", mouseOverFunction)
.on("mouseout", mouseOutFunction);
//add labeled text to each node
node.append("text")
.attr({
"y" : 25,
"text-anchor" : "middle"
})
.text(function (d) {
return d.id;
});

//tick event of network node
force
.on("tick", tick);

//map of all connected nodes index
data.content.links.forEach(function (d) {
linkedByIndex[d.source.index + "," + d.target.index] = true;
});

var tooltip = d3.select("body").append("div")
.attr("class", "tooltip")
.style("opacity", 0);
/**
* Event - mouseover for network nodes
* @param data
*/
function mouseOverFunction(d, i) {
if (d3.event.defaultPrevented) return;
tooltip.transition().duration(200).style("opacity", 1);
tooltip.html("<B>Properties</B><BR/><b>ID:</b>" + data.content.nodes[i].id + "<BR/><b>Type:</b>" + data.content.nodes[i].type+"<BR/><b>Status:</b>" + data.content.nodes[i].status)
.style({
"left" : (d3.event.pageX - 130) + "px",
"top" : (d3.event.pageY + 10) + "px"
});
}

/**
* Event-mouseout for network nodes
*/
function mouseOutFunction() {
if (d3.event.defaultPrevented) return;
tooltip.transition().duration(500).style("opacity", 0);
}
/**
* check for nodes connection
* @param a
* @param b
* @returns {Boolean}
*/
function isConnected(a, b) {
return isConnectedAsTarget(a, b) || isConnectedAsSource(a, b) || a.index == b.index;
}

/**
* check for node connection as soure
* @param a
* @param b
* @returns{boolean}
*/
function isConnectedAsSource(a, b) {
return linkedByIndex[a.index + "," + b.index];
}

/**
* check for node connection as target
* @param a
* @param b
* @returns {boolean}
*/
function isConnectedAsTarget(a, b) {
return linkedByIndex[b.index + "," + a.index];
}

/**
* This method can be used in conjunction with force.start() and force.stop() to compute a static layout.
*/
function tick() {
node
.attr({
"cx" : function (d) {
return d.x = Math.max(15, Math.min(width - 15, d.x));
},
"cy" : function (d) {
return d.y = Math.max(15, Math.min(height - 15, d.y));
},
"transform" : function (d) {
return "translate(" + d.x + "," + d.y + ")";
}
});
link
.attr({
"x1" : function (d) {
return d.source.x;
},
"y1" : function (d) {
return d.source.y;
},
"x2" : function (d) {
return d.target.x;
},
"y2" : function (d) {
return d.target.y;
},
});
}

/**
* zoomed function
*/
function zoomed() {
var e = d3.event,
tx = Math.min(0, Math.max(e.translate[0], width - width * e.scale)),
ty = Math.min(0, Math.max(e.translate[1], height - height * e.scale));
zoom.translate([tx, ty]);
containerGrp.attr("transform", ["translate(" + [tx, ty] + ")", "scale(" + e.scale + ")"].join(" "));
}

<span style="color:brown"><code>function dragstarted(d, i) {
force.stop(); // stops the force auto positioning before you start dragging
}

function dragged(d, i) {
d.px += d3.event.dx;
d.py += d3.event.dy;
d.x += d3.event.dx;
d.y += d3.event.dy;
tick(); // this is the key to make it work together with updating both px,py,x,y on d !
}

function dragended(d, i) {
d.fixed = true; // of course set the node to fixed so the force doesn't include the node in its auto positioning stuff
tick();
force.resume();
}
};// drawNetworkTopology() closed

drawNetworkTopology(data);

<span style="color:brown">
</body>
</html>
Types of Network Topologies
Network topologies can be broadly categorized into physical and logical topologies. Physical topology refers to the actual layout of cables and devices, while logical topology defines how data travels through the network, regardless of physical connections.
1. Ring Topology In a ring topology, nodes are connected in a closed loop, where each device is linked to two others, forming a continuous pathway for data. While ring topology minimizes data collisions, a single node failure can break the entire loop.
2. Mesh topology provides redundant paths between nodes, ensuring high reliability. In a full mesh, every node connects to every other node, while in a partial mesh, only critical nodes have multiple connections. This topology is robust but expensive and complex to implement due to the high number of connections.
3. Tree topology combines characteristics of bus and star topologies. Nodes are arranged hierarchically, with branches connecting multiple star networks to a central bus backbone. This structure is scalable and supports large networks but becomes inefficient if the backbone fails.
4. Hybrid topology integrates two or more different topologies to leverage their advantages. For example, a network might combine star and ring topologies to balance cost, performance, and reliability. While flexible, hybrid topologies can be complex to design and maintain.
Importance of Network Topology Graphs
Network Design and Planning A well-designed topology graph helps network engineers optimize performance, minimize latency, and ensure efficient data routing. By visualizing connections, they can identify potential bottlenecks and plan for future expansions.
Troubleshooting and Maintenance When network issues arise, a topology graph serves as a diagnostic tool. Administrators can trace data paths, isolate faulty components, and implement fixes without disrupting the entire network.
Security and Compliance Understanding network topology is crucial for implementing security measures. By mapping connections, administrators can identify vulnerable points, enforce access controls, and comply with regulatory standards.
Conclusion
A network topology graph is an indispensable tool for visualizing and managing complex networks. By selecting the appropriate topology and maintaining accurate diagrams, organizations can enhance performance, security, and scalability. As technology progresses, adaptive and intelligent network designs will continue to shape the future of connectivity.