


Tools are helpful to save developers time. Looking into the demand of web technology everyday many new tools comes into the market. Among these tools Firebug is a popular one. Using Firebug a web developers can easily monitor, debug or edit HTML, CSS, JAVASCRIPT or Jquery codes. To install Firebug you can download the latest version from https://getfirebug.com/downloads/. Also you can install Firebug as an addon in Mozilla Firefox. To do this go to Tools > Addons or press CTRL + ALT + A. Search Firebug & install. After successful installation restart your browser. Then press F12 to open Firebug. In below read our manual to get started.
There are various tabs available in default window of Firebug. Console, HTML, CSS, Script, DOM & NET. Using Console you can see the error or you can watch value of a print statement. HTML tab will show you the current page HTML source code. Here you can add or edit HTML in real-time. CSS & Script tabs is similar to HTML tab functionality. Using this tabs you can watch related CSS & JS files. If multiple CSS or JS files attached to your page you can use dropdownlist (shown in top bar) to select the required file. DOM tab presents Document object model hierarchy. Net tab is useful to track network related responses.
How to use Firebug?
Firebug was a powerful web development tool that allowed developers to inspect, edit, and debug HTML, CSS, and JavaScript in real time. Integrated as a browser add-on for Mozilla Firefox, it provided a crucial set of utilities for front-end developers, enabling them to analyze and optimize their web applications efficiently.
1. Without interacting with the real source code you can use inspect elements to edit HTML & CSS. This process saves lot of time & efforts. Also it reduces the chance of risk to work directly with files. In case you want to test some HTML or CSS related changes you can do this in real-time using Firebug. Once changes are done properly you can copy the codes to related files.
Let’s take a case where you want to adjust a div height just similar to an image height. In this case without using Firebug you need to measure the image height & then you will update the height for the div. But using firebug you can update the height attribute in real-time. When the height will look similar you can copy that value to your code file. This approach is programmers friendly & saves time.
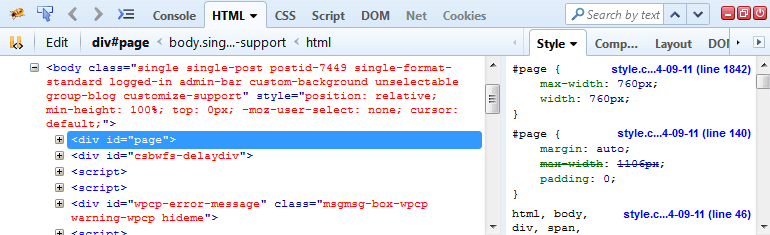
2. During development some time it is difficult to know where CSS boxes are located. In this case Firebug is very helpful. Firebug has its own eyes. While you select the block of code it will show you how much areas the CSS box model affects in your HTML. Look at the below image you will get idea how it works.

3. To optimize a web page it is mandatory to observe network activity. I mean which process or resource takes how much memory & time to load. Firebug is rich with this facility. Using its network monitoring tool you can easily know which thread breaks performance. To guide you how to perform network checking look at the below image.

Using Firebug network observation tool you can know the Status (Request is Fail or Passed), From which domain response backs, Size of the file & Timeline (How much time the resource need to load).
4. One more advanced feature of Firebug is it provides JAVASCRIPT & Jquery debugger. While you run a HTML file this tool will show you how many JAVASCRIPT files are related to that particular HTML page. If in any JS file you want to know the execution you can set breakpoints & debug like a professional debugger.

5. During web development unknowingly we left many errors in page. Thanks to Firebug which helps to detect all those error for a error free web page. To know about the list of errors you page has. Go to Console window & all errors tab.

6. The Document Object Model (DOM) is a great big hierarchy of objects & functions just waiting to be tickled by JavaScript. Firebug helps you find DOM objects quickly and then edit them on the fly.

Features of Firebug
1. HTML Inspection and Editing Firebug allowed users to inspect and modify HTML elements on a live webpage. By hovering over elements in the browser, developers could see the corresponding HTML structure in the Firebug panel. They could also edit HTML on the fly, with changes reflected immediately in the browser.
2. CSS Debugging and Live Editing The add-on provided a detailed view of CSS rules applied to any element. Developers could modify styles in real time, enabling quick experimentation without altering the source files. This feature was particularly useful for fine-tuning layouts and troubleshooting styling issues.
3. JavaScript Debugging Firebug included a robust JavaScript debugger with breakpoints, step-through execution, and variable inspection. Developers could pause script execution, examine call stacks, and identify errors efficiently, making it easier to diagnose and fix bugs.
4. Network Monitoring The Net panel in Firebug displayed all HTTP requests made by a webpage, including load times, response codes, and data sizes. This helped developers optimize performance by identifying slow-loading resources or unnecessary requests.
5. DOM Inspection The Document Object Model (DOM) panel provided a structured view of the webpage’s DOM tree. Developers could explore properties and methods of JavaScript objects, aiding in debugging and scripting.
6. Console for Logging and Testing Firebug’s console allowed developers to log messages, run JavaScript commands, and test snippets of code directly within the browser. It also displayed errors and warnings, making it easier to track issues.
Advantages of using Firebug
Real-Time Feedback
One of the most significant advantages of Firebug is its ability to provide real-time feedback during web development. Unlike traditional debugging tools that require constant page refreshes, Firebug allows developers to inspect and modify HTML, CSS, and JavaScript on the fly. This immediate feedback loop accelerates the development process by enabling quick identification and resolution of issues. For instance, changes made to CSS properties in the Firebug panel are instantly reflected on the webpage, eliminating the need for manual refreshes. This feature is particularly useful for front-end developers who need to fine-tune layouts, test different design elements, or troubleshoot rendering inconsistencies efficiently.
Additionally, Firebug’s real-time console logs JavaScript errors, network requests, and other runtime data, allowing developers to monitor application behavior without interrupting their workflow. This capability ensures that errors are caught early, reducing debugging time and improving overall code quality.
User-Friendly Interface
Firebug’s intuitive and well-organized interface makes it accessible to both novice and experienced developers. The tool is seamlessly integrated into the Firefox browser, providing a familiar environment for users. Its tab-based layout categorizes functionalities such as HTML inspection, CSS editing, JavaScript debugging, and network monitoring, making it easy to navigate between different aspects of web development.
The HTML panel, for example, presents a clean, hierarchical view of the DOM, allowing developers to expand or collapse elements for better readability. Similarly, the CSS panel displays all applied styles in a structured manner, with the ability to toggle individual properties to see their effects. The console panel offers autocomplete suggestions for JavaScript commands, reducing the likelihood of syntax errors and speeding up the coding process.
This user-centric design minimizes the learning curve, enabling developers to focus on problem-solving rather than struggling with complex tool navigation.
Enhanced Debugging Capabilities
Firebug excels in providing advanced debugging features that streamline the troubleshooting process. Its JavaScript debugger includes breakpoints, step-through execution, and variable inspection, allowing developers to analyze code execution in detail. By setting breakpoints at critical points in the script, developers can pause execution and examine variable states, call stacks, and scope chains, making it easier to identify logic errors.
The tool also offers a powerful console for executing JavaScript commands directly, which is invaluable for testing snippets of code or experimenting with APIs. Error messages in the console are detailed and often include line numbers, helping developers quickly locate and fix issues.
Another standout feature is the network monitor, which tracks all HTTP requests made by the webpage. Developers can analyze request headers, response headers, payloads, and loading times, which is essential for optimizing performance and diagnosing server-related issues.
Extensibility
Firebug’s extensibility is another major advantage, as it supports a wide range of plugins and extensions that enhance its functionality. Developers can customize the tool to suit their specific needs by adding features like color pickers, code validators, or performance analyzers. This modular approach ensures that Firebug remains relevant as web technologies evolve.
The open-source nature of Firebug encourages community contributions, leading to a rich ecosystem of add-ons. Whether it’s integrating with version control systems, supporting new frameworks, or adding accessibility checks, Firebug’s extensibility makes it a versatile tool for diverse development scenarios.
Legacy and Alternatives
Firebug played a pivotal role in shaping modern web development tools. Many of its features inspired the developer tools now found in Chrome, Edge, and Safari. Today, tools like Chrome DevTools and Firefox Developer Tools offer even more advanced capabilities, but Firebug remains a milestone in web development history.
For those looking for similar functionality, modern alternatives include:
Chrome DevTools – A comprehensive suite for debugging and profiling web applications.
Firefox Developer Tools – The successor to Firebug, integrated directly into Firefox.
Microsoft Edge DevTools – Offers powerful debugging and performance analysis.
Conclusion
Firebug revolutionized web development by providing an all-in-one solution for debugging and inspecting web pages. While it is no longer actively maintained, its influence persists in today’s browser-based developer tools. Understanding its features and legacy helps developers appreciate the evolution of web debugging tools and the convenience they now offer. The transition from Firebug to integrated browser tools marks a significant progress in making web development more efficient and accessible.